
Visualisation
BEAM is based on an advanced inhouse developed processing, evaluation and visualisation software which shows the measuring data and distribution of percentage frequency effect PFE and resistivity R for geological classification and hydrogeological characterization.
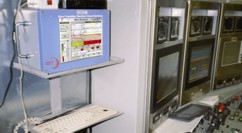
BEAM Unit in operator cabin,
e.g. Metro Barcelona
INTEGRAL Visualisation
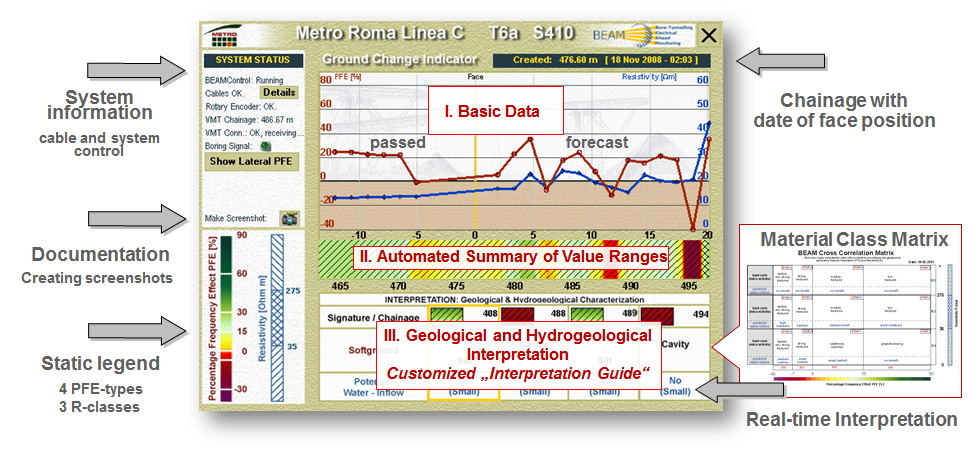
On the screen a vertical fixed yellow line indicates the current face respectively position of the cutter head of the TBM.
Forecast results in the form of survey points are “moving” strokewise from right to left whereby the red curve represents the PFE [%] which characterizes the rock mass regarding fracture/karst porosity information.
The blue curve indicates the resistivity R [Ohm m] which provides information about the fracture/cavity infillings (e.g. water, gas/air, clay).
In the middle chart the combined PFE (colour) and R (hachures) geoelectrical-geological rock mass classification is refreshed after every stroke.
Unique feature of the software program is a dynamic interpretation guide which has integrated a correlation matrix. of PFE and resistivity values for indication of geological and hydrogeological results with every stroke.
Any significant ground change ahead of the face is shown in a new text box with characterization of rock mass types, signature and tunnel meter as well as an estimation of potential water- and/or gas-inflow into the tunnel.
BEAM-SCAN Visualisation
The Lateral PFE Distribution View is a feature available by BEAM-SCAN system only.
Pre-selected excavation tools are prepared to act as measuring electrodes enabling a high resolution scan of the forefield ground during rotation of the cutterhead resp. cutting wheel.
The additional PFE lateral distribution can be used for more detailed location and geometry of obstacles, cavities and ground changes.
With a button on the left side one may switch anytime between the Ground Change Indicator View (INTEGRAL-mode) with geological classification as well as hydrogeological characterization and the Lateral PFE Distribution View (SCAN-mode).
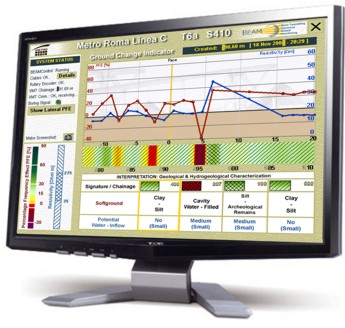
BEAM INTEGRAL user interface: e.g. simultaneously indication of BEAM forecast results on a monitor placed outside the tunnel; BEAM results indicate a cavity zone of about 2m thickness and medium water content in a distance of about 4m ahead of the face yet, whereby the first detection was shown in a distance of 3-times the tunnel diameter which means 20 m ahead of the face in this example.
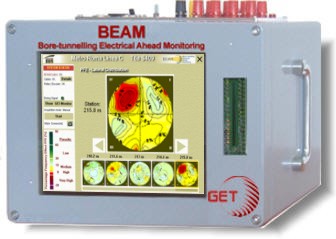
BEAM SCAN view indicates the lateral PFE distribution within a cross-section in a distance of 3-times the tunnel diameter (SCAN-mode); On the screen a red anomaly shows a cavity (high porosity zone) within pyroclastics which will occur on top and left of the TBM.
Introduction
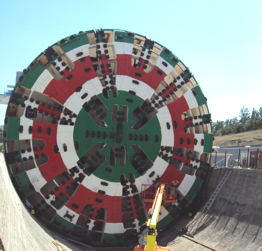
![]() The Bore-Tunnelling Electrical Ahead Monitoring - BEAM -, developed and patented by Kaus et. al., MD of GET, is a geophysical ground prediction technique for modern TBM headings.
The Bore-Tunnelling Electrical Ahead Monitoring - BEAM -, developed and patented by Kaus et. al., MD of GET, is a geophysical ground prediction technique for modern TBM headings.
System
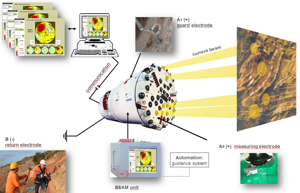
![]() The TBM based BEAM system allows a fully automatically and permanent driving accompanying exploration of ground conditions about 3 times the tunnel diameter.
The TBM based BEAM system allows a fully automatically and permanent driving accompanying exploration of ground conditions about 3 times the tunnel diameter.
References
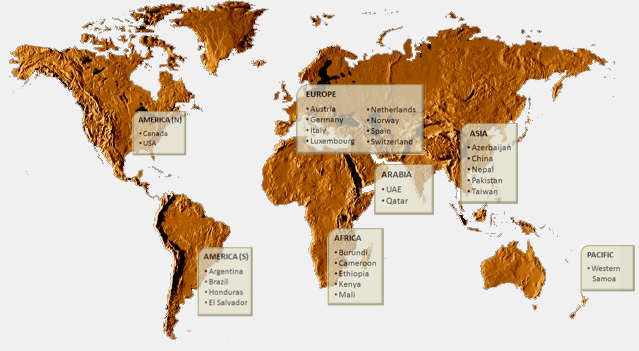
![]() Successful commercial application of BEAM® is realized since 2000 for more than 80 international tunnel projects, thereof 74 TBM projects with a total length of more than 300 km.
Successful commercial application of BEAM® is realized since 2000 for more than 80 international tunnel projects, thereof 74 TBM projects with a total length of more than 300 km.